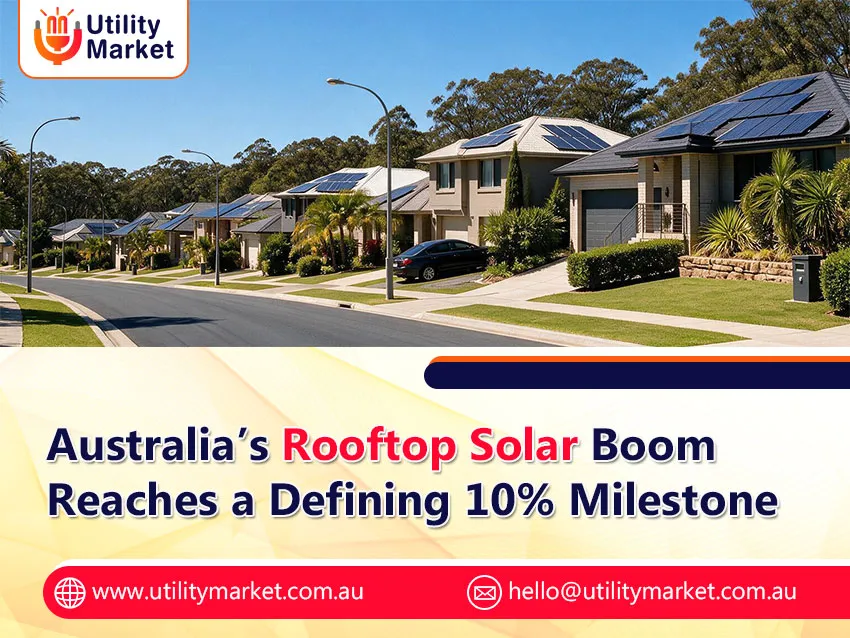
Australia’s Rooftop Solar Boom Reaches a Defining 10% Milestone
Published August 18, 2026
In 2023, rooftop solar accounted for 10% of the overall Australian electricity generation. In this year, according to the Clean Energy Council, rooftop solar panels at residential and small business premises accounted for 11.2% of all energy generation in the country. Since then, its proportion has continued to grow. In the second part of 2025, 14.2% of all electricity produced in Australia came from rooftop solar. Currently, 4.3 million Australian premises use rooftop solar panels. The total amount of installed capacity is 28.3 GW, surpassing even the full generation capacity of the coal-fired plants in the country, which amounts to 22.5 GW. No country in the world has this much rooftop solar capacity on a per capita basis. If you consider installing a panel on your property, comparing retailers makes all the difference.
How Did Australia Get Here So Fast?
There have been a number of things responsible for this development. Some of Australia’s solar power records that tell the story are as follows:
Queensland: The first to install over one million solar systems in rooftops.
New South Wales: It has the largest installed capacity of about 8 GW.
85,000 home battery units: Installed in the first half of 2025 almost 191% increase from last year.
183,245 batteries: Installed in the second half of 2025 almost more than in the past four years combined.
Renewable energy: It set a new high of supplying 51% of NEM energy in Q4 2025.
Today, one out of three homes and companies in Australia use solar energy. The Integrated System Plan by AEMO estimates 36 GW rooftop solar by 2030. Based on the current trends, it is estimated that Australia will achieve 37.2 GW by June 2030.
Power Generated from Solar Panels on an Average Aussie Rooftop
The average rooftop system installed in 2025 is 11.08 kW. The amount of power generated varies according to system size, location and roof orientation. Below are the results for various system sizes for an average Australian Location.
| Solar System Capacity | Typical Daily Generation | Estimated Annual Generation |
|---|---|---|
| 5 kW | 18–22 kWh | 6,500–8,000 kWh |
| 6.6 kW | 24–30 kWh | 8,500–11,000 kWh |
| 10 kW | 36–45 kWh | 13,000–16,500 kWh |
| 13 kW+ | 47–58 kWh | 17,000–21,000 kWh |
Such figures keep on changing with the seasons. This kind of seasonal variation is among the key reasons why residential battery systems have become such a success. It is the reason why it is important to lock in a fixed rate. Under the Energy Australia Secure Saver Plan, your rates remain unchanged for the entire contract period. Even in months of reduced output, you know exactly how much you pay using the grid.
Why Does the 10 Percent Mark Really Matter?
Once residential solar reached 10 percent of total Australian electricity production, it meant that private households collectively have created one of the biggest power generating facilities in the country. Not some government program. Not some mining company. Regular Australians with solar panels on the roof. As data from the Clean Energy Council shows:
- It is the second biggest producer of renewable electricity in the country after wind
- Fourth biggest producer of electricity overall
- Saves households between $1,500 a year in electricity bills, almost double in case of batteries nearly doubling that figure.
The milestone has changed the way the energy market operates. During peak solar hours, roof-mounted systems now bring about a substantial drop in the wholesale electricity prices. During Q4 of 2025, the average wholesale price per MWh was only $50 across NEM, which is 44% lower compared to Q4 of 2024. Rooftop owners producing solar electricity during the day are driving down the prices for all.
How Does Your Energy Plan Influence What You Get from Solar Panels?
Your panels generate the electricity. However, it is your energy provider and plan that will decide what will happen with electricity that is not used. There are two figures that are essential here:
Feed-in tariff: how much money you receive per kWh for extra solar power sent to the grid
Usage rate: how much money you pay per kWh using electricity from the grid after sunset
Even a difference of 2 to 3 cents per kWh of your feed-in tariff may have an effect on your profits during the whole 25 years of your solar panel’s lifetime. With the Energy Australia Secure Saver plan, your electricity prices are fixed for the whole contract period, so you can be sure of your savings in advance.
To Conclude,
Now, the rooftop solar contributes to more than 10% of total Australian electricity generation, with millions of homeowners making their contribution to record amounts of renewable power produced and increasing battery storage capacity. It is affecting the energy market of the country and reducing the cost of electricity production during peak solar hours.
If you’re looking to understand more about rooftop solar Australia and the future of clean energy, Utility Market is here to help you stay informed.
Follow Utility Market on Instagram for more energy insights, tips and updates.